みんな大好きmatplotlib
コマンドが覚えきれなくなってきたので、自分用メモとしてまとめます。
慣れていない人のために一応説明すると、
import matplotlib.pyplot as plt
でmatplotlibをpltとしてインポートしたあと以下のコマンドが使える。
自分は基本的にはplt.hogeで書く。ただオブジェクト指向的な書き方をするときは、fig = plt.figure() ax = fig.add_subplot(111)みたいにインスタンスを作って、その後にax.hogeなどとして図を調整する。
文字制御
上付き・下付き文字の大きさ変更
import matplotlib
import matplotlib.pyplot as plt
import numpy as np
matplotlib.mathtext.SHRINK_FACTOR = 0.5
matplotlib.mathtext.GROW_FACTOR = 1 / 0.5
このSHRINK_FACTORなどの数字を変えればOK
matplotlibではtexの\tiny,\HUGEコマンドなどが使えない・・・
図中に文字を挿入
fig = plt.figure()
ax = fig.add_subplot(111)
ax.text(2, 6, r'hogehogehogeeee', fontsize=15)
文字の大きさを変える(権限強)
matplotlib.rcParams.update({'font.size': 20})
軸調整
軸のラベルをかく
plt.title("Graph Title")
plt.xlabel("X-axis")
plt.ylabel("Y-axis")
x軸を対数に
plt.xscale("log")
x軸y軸などの目盛大きさを変更
ax1.tick_params(axis='x', labelsize=20)
ax1.tick_params(axis='y', labelsize=20)
plt.subplots()などで作ったax1のアトリビュートを変えればOK
主目盛と小目盛の長さ・太さを指定
ax2.tick_params(which='major',width = 1.0, length = 10)
plt.tick_params(which='minor',width = 0.5, length = 5)
軸の描画範囲を変更
plt.ylim(0, 5000)
x軸の目盛間隔を指定
plt.xticks([0.60,0.70,0.80,0.90,1.00])
minor_ticks=[0.55,0.65,0.75,0.85,0.95]
ax1.set_xticks(minor_ticks,minor=True)
ax1.xaxis.set_major_formatter(FormatStrFormatter('%.2f'))
めちゃくちゃ汚い書き方だ
軸の有効数字を指定
ax1.xaxis.set_major_formatter(FormatStrFormatter('%.2f'))
(0.6を0.600みたいに書きたいとき役に立つ)
軸を消す
plt.axis('off')
軸の数字を消す
# Create Figure and Axes instances
fig,ax = plt.subplots(1)

# Turn off tick labels
ax.set_yticklabels([])
ax.set_xticklabels([])
レジェンド
レジェンドの枠線を消す
plt.legend(frameon=False)
レジェンドのデータ線の長さを変更
plt.legend(handlelength=5)
レジェンドのscatterpointsを一つに
legend(scatterpoints = 1)
デフォで3つ(なぜ三つなのだ・・・
レジェンドの位置指定
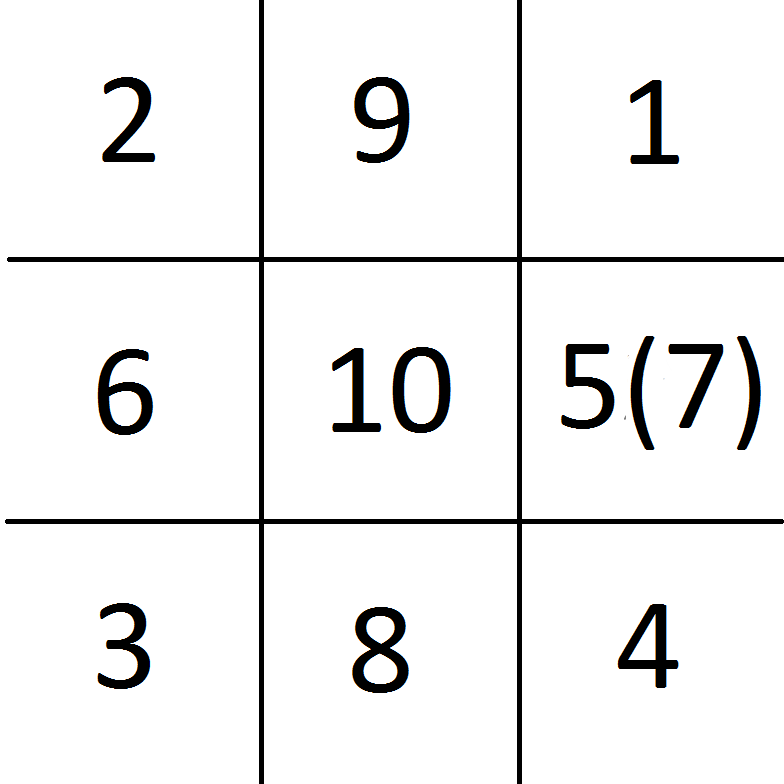
1~10の数字で、図の右上にレジェンドを~とか左下に~とかいうふうに指定することができる。
ただ、この数字の並びが厄介でいつも忘れるので図にまとめた

ユーザーをおちょくってるとしか思えない。
ちなみに詳細な位置指定はloc=(0.8,0.6)のような形でできる。
このとき「legendの左下がxmax×0.8,ymax×0.6が来るような位置」という意味
その他
グラフから文字がはみ出る!
plt.tight_layout()
図にinsetを追加
fig = plt.figure()
left, bottom, width, height = [0.6, 0.6, 0.3, 0.3]
ax2 = fig.add_axes([left, bottom, width, height])
解像度指定
plt.savefig('fuck.tif', dpi=600)
図にテキストを追加
ax1.text(10.5, 10, r'本宮佳奈たそは俺の嫁', fontsize=20,color='darkcyan')
ここで最初のx,yは図のx,yの値に準拠
カラーバーの上に説明書き
import numpy as np
import matplotlib.pylab as plt

dat = np.random.randn(10,10)
plt.imshow(dat, interpolation='none')

clb = plt.colorbar()
clb.set_label('label', labelpad=-40, y=1.05, rotation=0)

plt.show()
数値の有効数字
有効数字ではないけど、小数点以下○○桁というかたちで指定できる
n = 123.987654
round(n,0) = 124.0
round(n,1) = 124.0
round(n,2) = 123.99
目的のコードがこの記事にない場合・・・
公式のドキュメントが充実してるので、参照することをおすすめ
90%ここで解決する
The Pyplot API — Matplotlib 2.1.0 documentation
それでもダメな場合はStackFlowのようなサイト(プログラムに特化した英語版知恵袋みたいな感じ、みんな親切)
Stack Overflow - Where Developers Learn, Share, & Build Careers
で過去の質問を漁ろう。