こういうのをかきたい
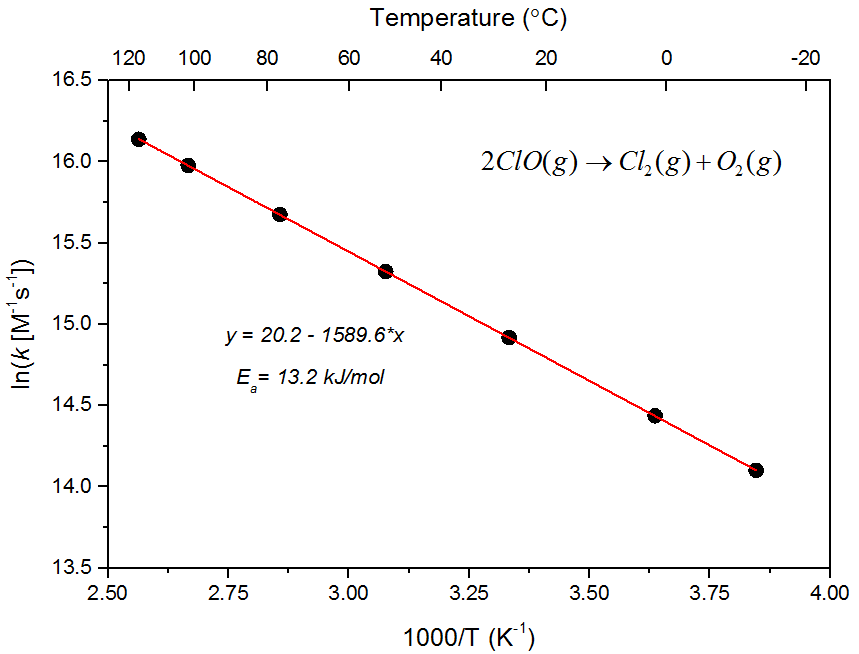
こうする↓
from scipy.constants import physical_constants
kB=physical_constants['Boltzmann constant in eV/K'][0]

import numpy as np
arange=np.arange
exp=np.exp

tt=arange(18.,501.)
vv=exp(-0.02/(kB*tt))

import matplotlib.pylab as plt
from mpl_toolkits.axes_grid.parasite_axes import SubplotHost

fig=plt.figure(1)
ax1=SubplotHost(fig, 111)
fig.add_subplot(ax1)

ax1.plot(1./tt,vv)
ax1.set_yscale('log')
ax1.set_xlabel('Reciprocal temperature (1/K)')


ax2=ax1.twin() # ax2 is responsible for "top" axis and "right" axis
tticks=np.array([20.0,30.0,50.0,100.0,300.0])
ax2.set_xticks( [ 1/t for t in tticks ] )

ax2.set_xticklabels(['20','30','50','100','300'])
ax2.axis["top"].label.set_visible(True)
ax2.set_xlabel('Temperature (K)')
ax2.set_yticks([])

plt.show()

"""
Python 2.5.4 |EPD 5.1.1| (r254:67916, Sep 25 2009, 12:11:02) [MSC v.1310 32 bit (Intel)] on win32
matplotlib 0.99.1.1
"""